>
Innovation & Impact
>
Holographic Interfaces in Finance: Immersive Data Visualization

Holographic Interfaces in Finance: Immersive Data Visualization

12/20/2025
Robert Ruan
Holographic Interfaces in Finance: Immersive Data Visualization

Imagine a world where financial data comes to life, not confined to flat screens but as dynamic 3D holograms you can walk through and touch.

This is the reality of holographic interfaces in finance, a groundbreaking innovation that is transforming how we understand and interact with complex information.

By harnessing AR and VR technologies, these systems convert abstract numbers into spatial experiences, making data more intuitive and actionable.

The shift from 2D to 3D visualization is not just about aesthetics; it's about enhancing clarity, speed, and collaboration in high-stakes environments.

As financial markets grow more volatile, the ability to process information rapidly becomes a critical competitive edge.

Holographic interfaces offer a solution by immersing users in data, allowing for deeper insights and faster decision-making.

The Core Concept: A New Dimension in Financial Analysis

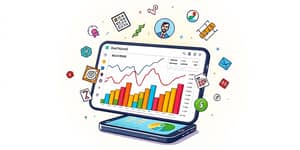
At its heart, holographic interfaces enable immersive 3D data visualization of real-time financial data such as market trends and portfolios.

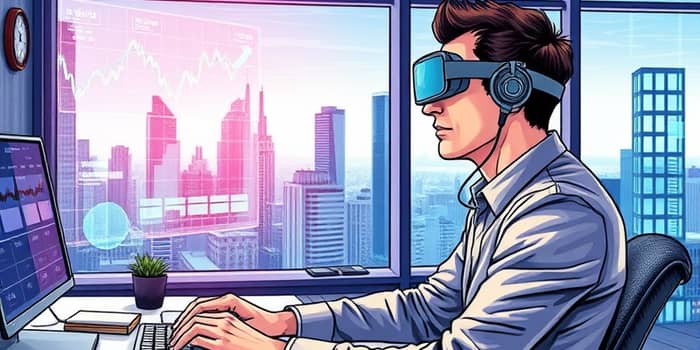
This technology uses devices like Microsoft HoloLens or Apple Vision Pro to blend traditional screens with interactive holograms.

Users can engage through gestures, voice commands, or gaze, creating a natural and collaborative workflow.

The goal is to turn overwhelming datasets into manageable, spatial representations that boost efficiency.

For instance, traders can spot anomalies in seconds, while analysts explore risk metrics from multiple angles.

This approach reduces cognitive load and increases engagement, leading to more informed strategies.

Pioneering Implementations: Real-World Success Stories

Several leading examples showcase the practical benefits of holographic interfaces in finance.

  • Citi HoloLens Holographic Workstation (2016): Traders use a three-tiered display for dynamic market snapshots, enabling rapid assessment of trends like crude oil drops.
  • Immersion Analytics for Apple Vision Pro: Converts Tableau dashboards into immersive visualizations in minutes, speeding up development from years to weeks.
  • Flow Immersive: Offers browser-based tools for spatial portfolio analysis with AI-enhanced interaction over virtual tables.
  • MicroCloud Hologram Inc.: Develops quantum-enhanced holographic tech for advanced financial applications, pushing the boundaries further.

These cases highlight how early adopters are gaining an edge through enhanced data interaction.

By leveraging such tools, teams can collaborate remotely, share insights in real-time, and make decisions with greater confidence.

Technologies and Platforms: The Building Blocks of Innovation

A variety of devices and platforms power this transformation, each tailored to different financial needs.

These technologies integrate seamlessly with existing financial software, reducing the barrier to adoption.

For example, they can pull data from trading platforms or banks, ensuring real-time updates without disruption.

This compatibility allows organizations to enhance their workflows incrementally, minimizing risk.

Benefits: Efficiency, Clarity, and Collaboration

The advantages of holographic interfaces are manifold, directly impacting performance and outcomes.

  • Increased Efficiency: Users process large datasets faster, with tools like dynamic snapshots reducing analysis time from hours to minutes.
  • Enhanced Clarity: 3D visualizations make trends and anomalies more apparent, such as spotting high volume clusters in energy markets.
  • Real-Time Analysis: Systems provide live updates on volatility and historical comparisons, enabling proactive responses.
  • Improved Decision-Making: Interactive dashboards support "what-if" scenarios and predictive insights, leading to smarter investments.
  • Better Collaboration: Remote teams can share holograms immersively, fostering teamwork across distances.

These benefits translate into tangible gains, such as quicker trade executions or more accurate risk assessments.

By making data spatial, holographic interfaces tap into human perceptual strengths, boosting pattern recognition and intuition.

Visualization Techniques: Making Data Come Alive

Holographic contexts employ various methods to render financial data in compelling ways.

  • 3D Price Tiles and Tabs: Display futures and volume at specific price points with historical overlays for context.
  • Dynamic Snapshots: Offer market overviews with elements like equity indices or interest rates visualized spatially.
  • Risk Metrics Visualization: Use histograms, heatmaps, and contours to depict Value at Risk (VaR) and tail-risk scenarios.
  • Portfolio and Trend Graphs: Create immersive 3D graphs for geospatial profits or predictive models that users can explore.
  • AI-Enhanced Views: Automatically adjust visualizations, highlight key performance indicators, and predict trends in real-time.

These techniques ensure that data is not just seen but experienced, leading to deeper engagement.

For instance, a trader might use a heatmap to quickly identify areas of concern, then drill down for detailed analysis.

Practical Applications: How You Can Leverage This Technology

To get started with holographic interfaces, consider these actionable steps tailored for finance professionals.

  • Assess your current data needs: Identify pain points in your workflow where 3D visualization could add value, such as in risk management or portfolio reviews.
  • Explore compatible devices: Test platforms like HoloLens or Vision Pro to see which aligns with your infrastructure and budget.
  • Integrate with existing tools: Use APIs to connect holographic systems with software like Tableau or Power BI for a seamless transition.
  • Train your team: Provide hands-on sessions to familiarize users with gesture controls and collaborative features, boosting adoption rates.
  • Start small with pilot projects: Implement holographic interfaces in limited scenarios, such as client presentations or internal audits, to gauge impact.

These steps can help demystify the technology and make it accessible for everyday use.

By focusing on practical applications, you can unlock benefits like faster insights and reduced errors in data interpretation.

Challenges and Ethical Considerations

Despite its promise, holographic finance faces hurdles that must be addressed for widespread adoption.

  • Integration Complexity: Ensuring multi-device compatibility with desktop or mobile systems can be technically demanding.
  • Ethical Concerns: The immersive nature raises issues about data presentation accuracy and potential biases in accounting visuals.
  • Cost and Accessibility High initial investments in hardware and software may limit smaller firms from adopting these tools quickly.
  • Skill Gaps: Teams may need training to use advanced features effectively, requiring time and resources.

Overcoming these challenges involves collaboration between tech developers and financial institutions.

Ethical guidelines should be established to maintain transparency and trust in holographic data representations.

The Future: AI, Quantum, and Beyond

Looking ahead, holographic interfaces in finance are poised for exciting advancements driven by emerging technologies.

  • AI and ML Synergy: Enhanced anomaly detection and forecasting will make systems more predictive and prescriptive.
  • Quantum Enhancements: Companies like MicroCloud are exploring deep learning holograms for complex financial modeling.
  • Blockchain Integration: Tamper-proof transaction visuals could revolutionize audits and compliance processes.
  • AR/VR Expansion: Expect more immersive environments for market walkthroughs, replacing traditional 2D charts entirely.
  • Holographic Assistants: Potential to evolve into 3D interactions that surpass mobile banking, offering personalized financial advice.

These trends suggest a future where finance becomes more interactive, intelligent, and inclusive.

By staying informed, professionals can prepare for shifts that redefine industry standards and opportunities.

Holographic interfaces are not just a novelty; they are a transformative tool that empowers users to see data in new ways.

Embrace this innovation to enhance your financial strategies, foster collaboration, and navigate markets with greater agility.

The journey from flat screens to immersive worlds is already underway, offering a glimpse into a more connected and insightful financial landscape.

Robert Ruan

About the Author: Robert Ruan

Robert Ruan is a personal finance strategist and columnist at lifeandroutine.com. With a practical and structured approach, he shares insights on smart financial decisions, debt awareness, and sustainable money practices.